Overview #
The GTMSUI, a Windows platform user interface, provides users with full operational control over the GTCU main control unit and monitoring capabilities. This user-friendly software offers straightforward configuration settings for seamless operation.
- A single .exe file that requires no installation.
- Large visual displays showcasing real-time status updates of monitored and controlled equipment.
- Detailed reports of faults and events, ensuring comprehensive documentation of system performance.
Main Window / Chart #
Figure 1. #
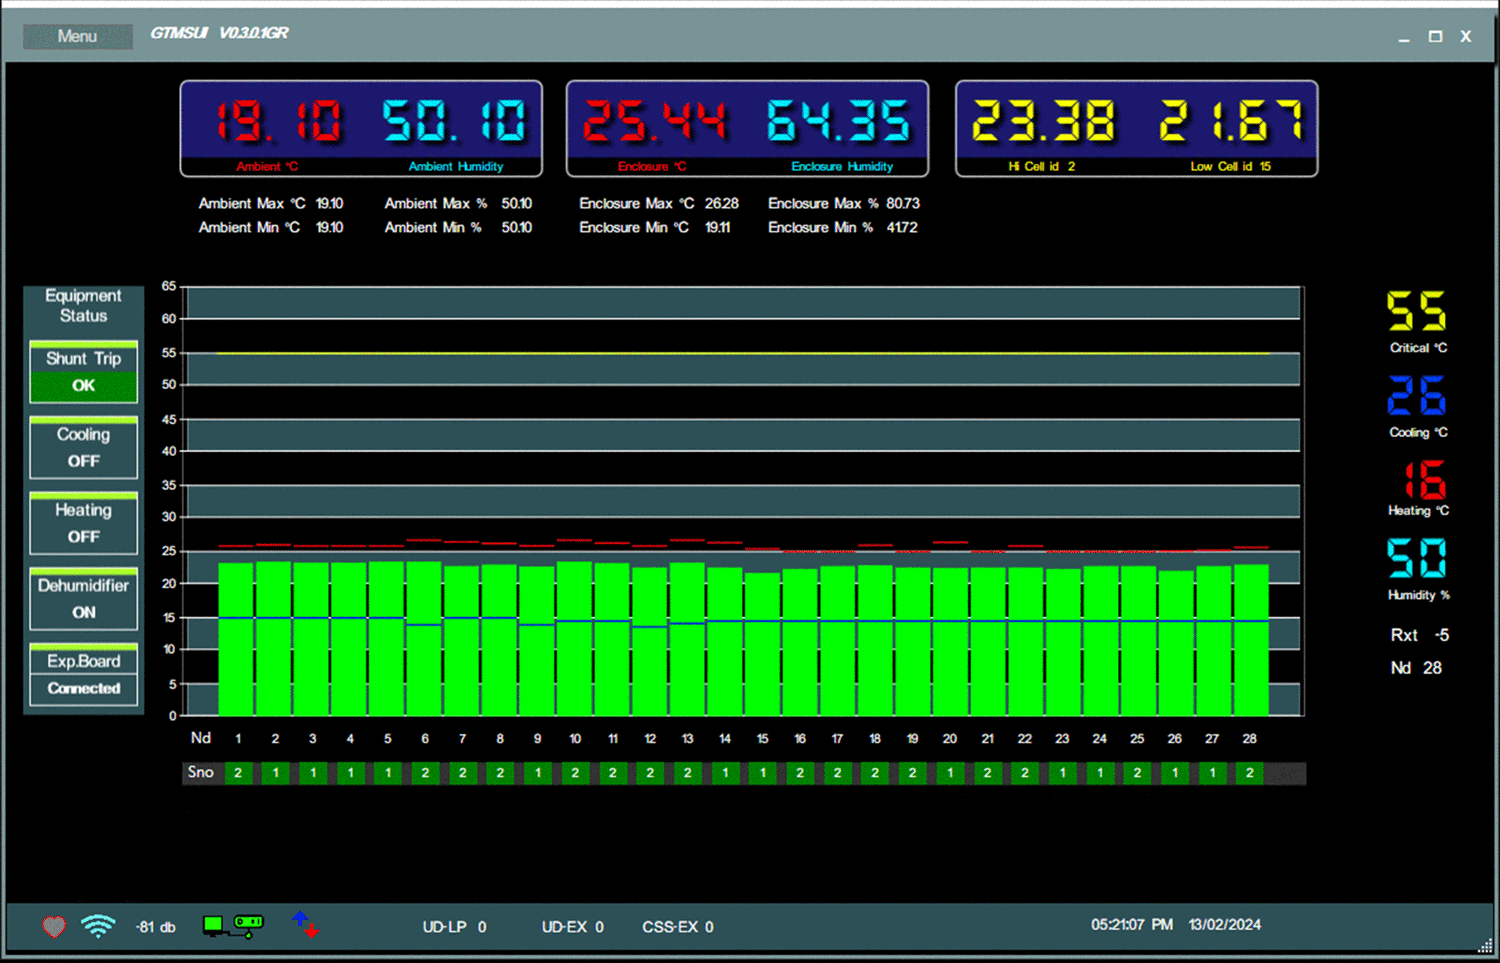
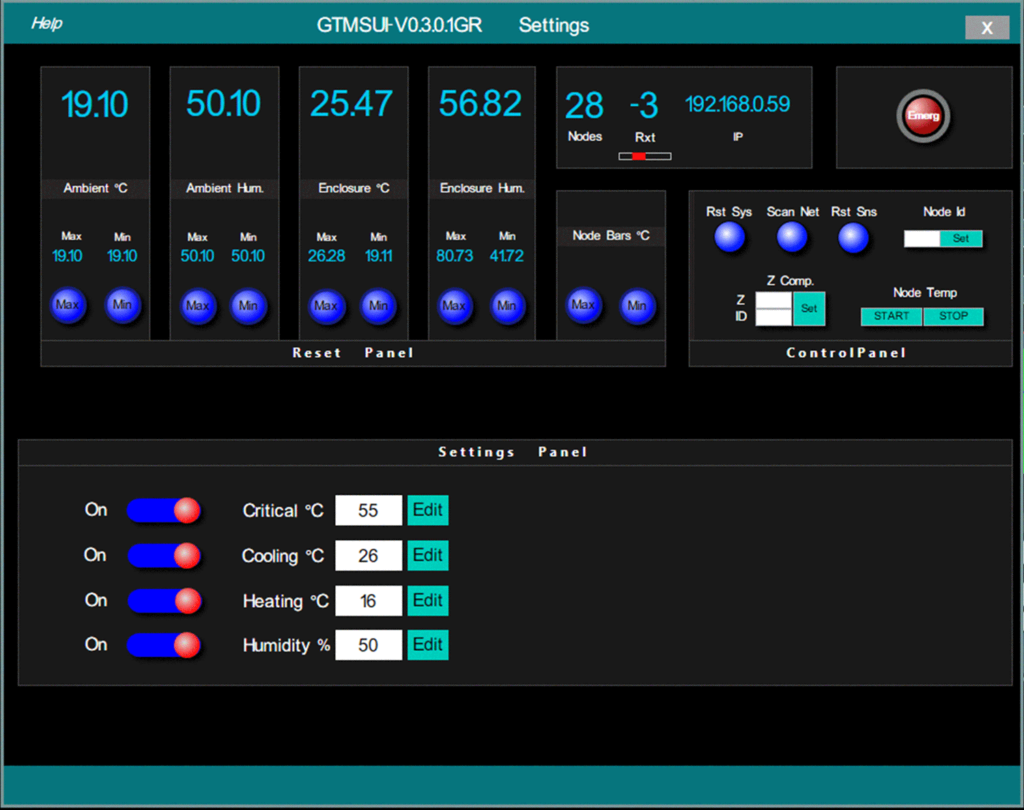
User-Friendly Interface: The GTMSUI main window is designed with a user-friendly layout and intuitive navigation features to facilitate ease of use and efficient system monitoring. Users can interact with the interface seamlessly to access relevant information and control functionalities.
Figure 2. #
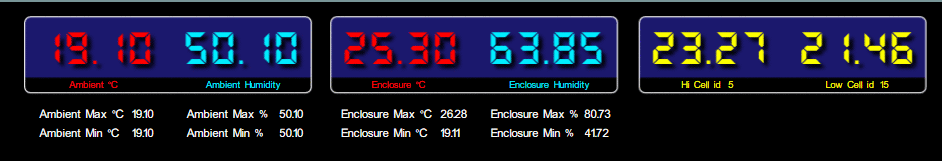
The top left display (Figure 2) showcases the current ambient temperature and humidity levels, along with the minimum and maximum values recorded. Similarly, the middle display shows the enclosure temperature and humidity, with corresponding minimum and maximum values. On the right display, you can view the current highest temperature of the monitored device/battery along with its ID, as well as the lowest temperature and ID of the monitored device/battery.
Figure 3. #

Equipment Status: #
In Figure 3, the Equipment status is displayed for the Shunt trip box, indicating the status of the Shunt trip C/B or any emergency cut-off device essential for switching off to protect the system in case of overheating.
Normal State Display: During normal operation, the status will display ‘OK’ with a green background, ensuring that the system is functioning within optimal parameters.
Overheating Alert: #
In the event of overheating, the status will show ‘TRIPPED’ with a red background, providing a clear indication of an abnormal condition that requires immediate attention.
Customizable Feature: #
Users have the flexibility to enable or disable this feature based on specific requirements. When activated, the bar above the ‘Shunt Trip’ label will turn green, indicating that the functionality is operational, and will turn black when deactivated.
Similar to the Shunt trip box feature, users have the flexibility to enable or disable the monitoring functionality for the Cooling, Heating, and Dehumidifier equipment based on specific operational requirements. The visual cue, such as a color change in the bar above the equipment label, provides a clear indication of the feature’s activation status.
PCRB Connected Status Display: #
When the relay board is successfully connected to the GTCU, the Expansion Board Box status will automatically turn green and display ‘Connected.’ This visual cue confirms the established connection between the relay board and the GTCU
Disconnected Alert: #
Conversely, if there is no relay board attached to the system, the Expansion Board Box status will show ‘Disconnected’ and it will turn black.
Unlike other equipment components, the Expansion Board Box status cannot be controlled through the user interface.
Figure 4. #
Settings Display in GTMSUI: #
Figure 4 presents the current settings within the (GTMSUI) for critical temperature values, cooling settings, heating settings, and dehumidifier settings. Additionally, it displays telemetry data related to communication reception and the number of connected TMUs.
Critical Temperature Value: #
The critical temperature value is configured to trigger the disconnection device in case of overheating. This threshold acts as a crucial safety measure to safeguard the system and equipment from potential damage due to excessive heat.
Cooling Settings: #
The cooling settings value determines when a fan or air-conditioning device will activate to cool down the enclosure or room. Once the temperature reaches the set value, the cooling equipment will be activated to regulate and maintain a suitable temperature level within the environment.
Heating Settings: #
Similarly, the heating equipment will switch on when the temperature falls below the set value, ensuring adequate heating to maintain optimal operating conditions within the system.
Dehumidifier Settings: #
The dehumidifier equipment will switch on when the humidity reaches the preset value, assisting in controlling and managing humidity levels within the monitored environment.
Telemetry Data Display: #
The telemetry data section provides information on the quality of data reception within the system. Positive values indicate good reception, while negative values signify disruptions or network congestion affecting data transmission and communication reliability.
TMU Connectivity Status: #
At the bottom of the display, the number of connected TMUs is indicated, offering insights into the system’s connectivity with Temperature Monitor Units.
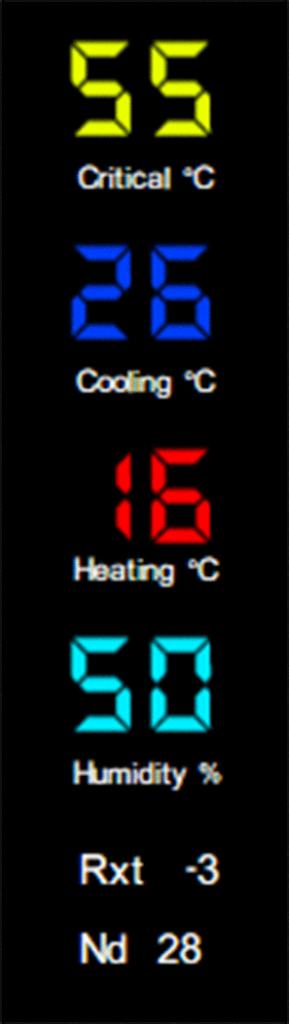
Figure 5. #
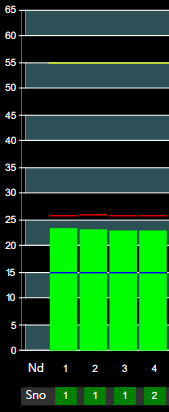
In Figure 5 of the User Interface (GTMSUI), the following features can be observed:
TMU Temperature: #
These columns visually represent the connected TMUs and display the temperature readings of each individual TMU. The temperature scale ranges from 0 degrees to 65 degrees, providing a comprehensive view of live temperature data.
Nd (nodes) and Sno (sensor number): #
At the bottom of the display, the Nd (TMU nodes) are numbered, and beneath that, the Sno (sensor number) indicates the NTC1B/NTC2R sensor currently registering the highest temperature among all connected TMUs. This information offers insight into temperature variations and monitoring across the monitored device.
Critical Temperature Threshold: #
Hovering above the green columns, a bold yellow horizontal line denotes the critical temperature threshold. Should the monitored device surpass this set value, the system will activate the Remote Tripp Relay to safeguard against overheating. The GTCU will promptly transmit a 1000ms pulse to trigger circuit breaker shutdown via the PCRB relay board, ensuring optimal system protection and temperature regulation. This essential setting can be conveniently programmed and adjusted within the user-friendly settings interface of the GTMSUI.
Highest TMU Temperature Level: #
Positioned above the green columns, a red horizontal line signifies the highest temperature recorded by the TMU (Temperature Monitoring Unit). This visual indicator highlights the peak temperature point reached within the monitored system, aiding in the identification of temperature extremes. This setting can be conveniently reset within the user-friendly settings interface of the GTMSUI.
Lowest TMU Temperature Level: #
Similarly, a blue horizontal line displayed in the green columns represents the lowest temperature measured by the TMU. This reference line assists in understanding temperature fluctuations and ensures comprehensive temperature monitoring across different nodes and sensors. This setting can be conveniently reset within the user-friendly settings interface of the GTMSUI.
Settings Window #
Figure 6. #
In this user-friendly interface, users can have complete control over the GTCU, allowing for precise management of temperature parameters and easy access to all necessary functions.